Review the history of the Graduate Interdisciplinary Forum with the graphs provided below.
Student participation graph: 1994-2012
| 1994 | 1995 | 1996 | 1997 | 1998 | 1999 | 2000 | 2001 | 2002 | 2003 | |
|
Number of Students |
7 |
24 |
35 |
72 |
44 |
62 |
55 |
79 |
112 |
144 |
| 2004 | 2005 | 2006 | 2007 | 2008 | 2009 | 2010 | 2011 | 2012 | |
| Number of Students |
127 |
160 |
115 |
100 |
94 |
117 |
79 |
85 |
86 |
Type of presentation: 1994-2012
| 1994 | 1995 | 1996 | 1997 | 1998 | 1999 | 2000 | 2001 | 2002 | 2003 | |
|
Oral |
7 |
24 |
30 |
33 |
23 |
39 |
40 |
44 |
66 |
75 |
|
Poster |
0 |
0 |
5 |
39 |
21 |
23 |
15 |
35 |
46 |
69 |
| 2004 | 2005 | 2006 | 2007 | 2008 | 2009 | 2010 | 2011 | 2012 | |
|
Oral |
53 |
60 |
54 |
43 |
47 |
45 |
36 |
40 |
24 |
|
Poster |
74 |
100 |
61 |
57 |
49 |
72 |
43 |
45 |
62 |
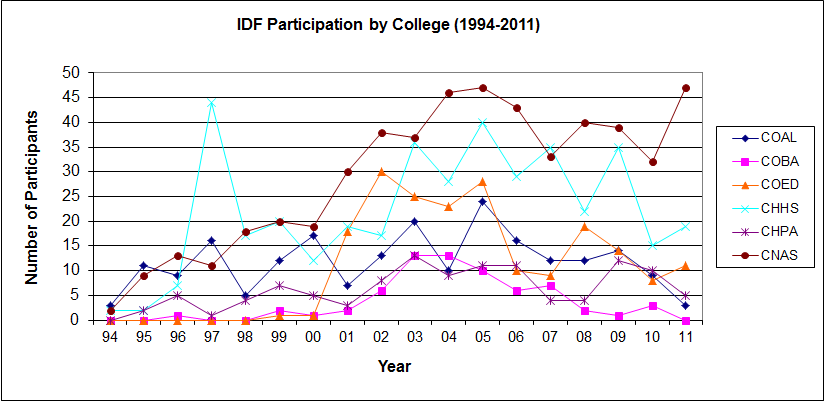
Participation by college graph: 1994-2012
Discover more from Graduate College Blog
Subscribe to get the latest posts sent to your email.