Missouri State University

Skip to content Skip to navigation
a b c d e f g h i j k l m n o p q r s t u v w x y z

Web Strategy and Development Blog

  • Web Strategy and Development
  • Web Support
  • @msuweb

What happened to my page views?

November 5, 2012 by admin

Google Analytics graph

Google Analytics graph
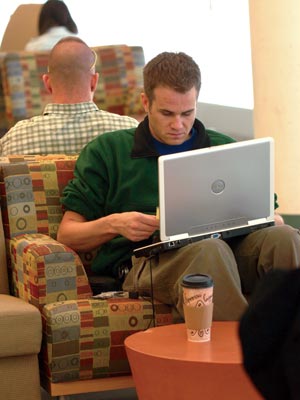
As part of the 2010 redesign, we standardized Google Analytics tracking. Any page that uses some form of the official templates automatically includes the Google Analytics tracking code and reports to our main Google Analytics account.

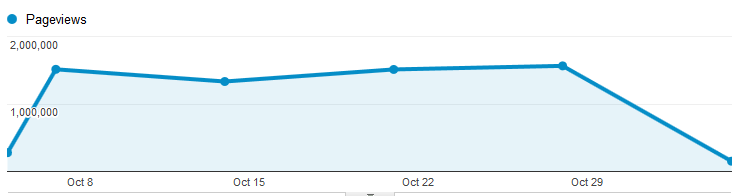
We recently made some changes to this code that will affect these measures and most likely cause sites to report a lower (but more accurate) page view count.

Linking to another site

We previously tracked links to other web sites as a page view. While this isn’t necessarily wrong, it inflates the page view count on our site. So if your site had a link to www.google.com we tracked it as if a user had actually viewed a non-existent page.

Compounding this problem was that the method we used to determine what was a different site was just wrong. We track all the missouristate.edu sites under a single account. But we were checking for external links by simply looking if the hostnames were different. We’ve now corrected that.

Links to external sites can now be found under event tracking. They are tracked under the Navigation category, external label.

Linking to Old method tracking New method tracking
www.google.com Page view: www.missouristate.edu/external/www.google.com Event: Navigation – external
criminolgy.missouristate.edu Page view: www.missouristate.edu/external/criminology.missouristate.edu
AND
Page view: criminology.missouristate.edu

File downloads

We also track links to certain files (like PDFs). Links to files of these types have been tracked as page views. However, with a multi-site setup, you can only track a page view to the same hostname. Files under the same hostname as the page will track as a pageview as they always have. Files on a different hostname (even a different missouristate.edu host) will track as an external link.

Linking to Old method tracking New method tracking
www.missouristate.edu/some.pdf Page view: www.missouristate.edu/some.pdf Page view: www.missouristate.edu/some.pdf
criminolgy.missouristate.edu/some.pdf Page view: www.missouristate.edu/some.pdf Event: Navigation – external

MailTo: links

We also changed the way in which we tracked links with a mailto: protocol. Previously these were tracked as a pageview to a non-existent url. They are now tracked as an event.

Linking to Old method tracking New method tracking
mailto:web@missouristate.edu Page view: www.missouristate.edu/mailto/web@missouristate.edu Event: Navigation – mailto

Filed Under: Redesign, Technical, web strategy and development Tagged With: google analytics, Redesign, tracking

How to measure the effectiveness of a direct marketing piece

September 25, 2012 by

Student at computer

Student at computerBy marrying print pieces, electronic newsletters and emails with a website, you can better track the effectiveness of the piece. Some natural connections between a direct marketing item and a website include asking your reader to RSVP online, register for an event, watch a video, download an app or access some other type of valuable information.

Directing a reader to a website allows you to use Web analytics to determine if your intended audience is following through on the call to action you provided. In this post, I’ve outlined three ways to determine the effectiveness of a print piece, email or newsletter.

Use a redirection

Make your URL user-friendly by using a redirect:

  • Keep it simple.
  • Don’t use numbers.
  • Connect it with your piece’s messaging, such as www.missouristate.edu/BeaBear

You can request a redirect online from the office of web and new media. Web and new media can provide you with a hit count for your redirect, or you can include tracking in the original (or destination URL) as discussed below.

Include tracking in your URL

Track usage of links by using campaign tracking. Campaign tracking allows you to count how many visits to a site came from social media, emails, newsletters, releases and more by defining the following:

  • utm_source= origin of referral (i.e. release, bulletin, homepage)
  • utm_medium= qualifies the source (i.e. email, online, feature)
  • utm_campaign= topic of link or promotion (i.e. diversity, summervisit)
  • utm_content= optional description of the campaign

These tracking pieces go at the end of your destination URL:

http://www.missouristate.edu/paw/?utm_source=homepage&utm_medium=photo&utm_campaign=publicaffairs&utm_content=paw

You can create custom URLs for your links using the Google URL Builder.  When creating and using custom URLs, remember the following:

  • Because the tracked URL is very long, hyperlink text or use it as the original URL in a redirect.
  • Keep track of how you categorize your source, medium and campaign.
  • Track the usage of the link through a Google Analytics campaign report.

Create a QR code

QR codes can be added to both print and electronic pieces to give your target audience a quick way to access online content. QR codes are most effective when they provide the user with content that enhances their experience, such as a direct way to download an app or to access a map of a building.

Because the actual use of QR codes is varied, consider the following items when determining if you should use a QR code:

  • Will my target audience know what this is and be able to use it?
  • Do I have mobile friendly content to share?
  • Is my content valuable to the end user? Will it enhance their experience?

QR codes are created using the Google URL shortener. When they are created, Google provides you with a shortened URL, the QR code image and a tracking link. Read the “How to create a QR code post” for more details.

Filed Under: web strategy and development Tagged With: google analytics

How to measure success with Google Analytics campaigns

April 20, 2012 by

Google Analytics provides a vast array of statistics to help you understand visitor characteristics, behavior and more. It can also assist in measuring, evaluating and planning online promotions or public relations plans.

Measuring, evaluating and planning

Measuring the outcomes of a promotion can be fairly straightforward. Typically, it focuses on the numbers, such as the number of visitors over a time period or the number of pages visited.

Evaluating goes a step deeper by using predetermined goals to determine the promotion’s success. Evaluation uses specific statistics to decide if the promotion reached its desired scope, generated the target amount of traffic or resulted in a specific action by visitors.

Planning involves understanding the dimensions, metrics and tracking tools in analytics and incorporating them into your communication tactics from the beginning.

Campaign tracking

Campaign tracking or tagging URLs is a basic way to begin evaluating the success of your promotions. By defining a source, medium and campaign for your destination URL, you can track visitors’ usage of links that you provide through social media, emails, newsletters, releases and more:

  • utm_source=origin of referral (i.e. release, bulletin, homepage)
  • utm_medium=qualifies the source (i.e. email, online, feature)
  • utm_campaign=topic of link or promotion (i.e. diversity, summervisit)
  • utm_content=further describes the campaign (optional—use if a campaign will cover multiple sites/topics

Example of campaign tracking

The Missouri State Magazine offers an online version of its print publication, including special online features. Links to the online site are provided via email, homepage features, social media and ads.

Campaign tracking is used to differentiate the traffic these sources create. When a new issue of the Missouri State Magazine is released, a new campaign is defined, such as fall2011mag. Then, source and medium are defined for each sharing of the link as shown below for the Bear Bulletin email:

  • utm_source=bearbulletin
  • utm_medium=email
  • utm_campaign=fall2011mag

The above tracking information is added to the back end of the magazine’s URL:

http://magazine.missouristate.edu/?utm_source=bearbulletin&utm_medium=email&utm_campaign=fall2011mag

Don’t forget to use the ? at the beginning and the & in between tracking elements. Because these links are long and rather ugly looking, it is best to embed them through hyperlinked text or shorten using a URL shortener like bit.ly.

The Google Analytics view of campaign tracking

So how does campaign tracking help? By defining a source for a direct link, you can cut down the number of direct referrals that show up in your analytics. Also, it helps you better determine how people are accessing your site and if they are using the links you provide.

One of the standard reports in Google Analytics is the Campaigns report under Traffic Sources. This report shows all campaigns—URLs with a defined utm_campaign—that drove traffic to your site.

The photo below shows the source/medium combination that directed the most traffic to the online Missouri State Magazine during its fall issue, which was defined as the fall2011mag campaign:


Filed Under: web strategy and development Tagged With: google analytics, promotion, Web

Learning the lingo: Understanding the language of analytics

August 29, 2011 by

At its basic level, Google Analytics provides a wealth of information about your website, user behavior and more. To better understand the basic reports found in Google Analytics, you must first understand the terms or metrics Google Analytics uses to categorize your site’s statistics.

Many of these terms are self-explanatory, but some are not. This post will define some of the common metrics used in Google Analytics reporting. An understanding of these common metrics will help you identify the information you want to know about your site, how to find that information and what metrics you want to focus on when creating custom reports.

Common terms

  • Bounce: a single-page visit to your site with no further actions taken
  • Bounce rate: the percentage of single-page visits that occur when a visitor immediately leaves a landing page
  • Campaign: a way to track or associate visitor activity with different sources and promotions, which are typically created by tagging URLs. Example campaigns include “Fall Recruitment,” “Undergraduate Admissions Guide” or “Move-In Weekend.”
  • Exit: the last page viewed by a user before leaving your site
  • Funnel: the defined process that a user takes to complete a goal, which is typically a set of Web pages that direct the user to an end goal
  • Goal conversion: occurs when a visitor completes an action (i.e. reaches a page) defined by you through Google Analytics as more valuable than a normal page view. Examples of a conversion include reaching a “Thank you for registering” or order confirmation page.
  • Goal conversion rate: the percentage of sessions on a site that resulted in a goal conversion
  • Landing page: the first page a Web visitor accesses when they enter your site
  • Medium: the means by which a visitor received the link to your site  in campaign tracking. Examples include email, PDF or a tweet.
  • Referrer: the page external to your site that a visitor clicked on that brought them to your site
  • Source: the origin of a referral in campaign tracking. Examples include newsletter, social media or print publication.
  • Visit (or session): the period of time a visitor is on your site, which begins when the browser loads the first page and ends when the browser is closed or the visitor has been inactive for 30 minutes

Unique versus non-unique

Several Google Analytics metrics offer a unique and non-unique counterpart:

  • Visitor: a site usage metric that counts the number of users who visit your site
  • Absolute unique visitor: all visits from the same user for the entire active date range you have selected are aggregated to count as a single unique visitor, regardless of how many visits that user actually made to your site

The visitor metric is the closest reflection of the number of actual people who visit your site. The unique visitor count can be compromised easily, so it is recommended to look at this metric as an overall trend not as a literal count.

The second common set of unique versus non-unique relate to how often pages are viewed on your site:

  • Pageviews: a count of the number of times a page is viewed or loaded
  • Unique pageviews: aggregate of the page views of a single user to reflect the number of visits a page was loaded at least one time (only counts the first load of a page during a user’s visit)

Dimensions versus metrics

When you are creating a custom report (to be discussed in a later post) or even navigating through one of the basic reports provided by Google Analytics, you may encounter the terms dimension and metric.

A dimension (in red) is a text string used to further define an item. Examples of dimensions include page title, URL, browser type and campaign name.

A metric (in blue) is a number, such as bounce rate, time on site or pageviews.

Writer’s note: Definitions were developed in consultation with “Advanced Web Metrics with Google Analytics” by Brian Clifton and the Google Analytics Help site.

Filed Under: Training, web strategy and development Tagged With: google analytics

Google Analytics bounce rate and custom reports

July 20, 2011 by

Three weeks ago I was able to attend a webinar on Google Analytics for higher education websites hosted by Stamats. This webinar focused on explaining a series of custom reports developed by the company. I wanted to share these reports along with an explanation of a common Google Analytics statistic—bounce rate.

Bounce rate

When you open about any report in Google Analytics, bounce rate is a common statistic provided. But what does bounce rate mean?

Bounce rate refers to the percentage of single-page visits which occur when a visitor immediately leaves a landing page.

A low bounce rate is 40-45 percent. A decent bounce rate is 45-60 percent. If the bounce rate for a particular site is higher than 60 percent, you may want to examine how visitors are getting to that page and evaluate if your content is valuable to those visitors.

What does it tell you?

If the bounce rate is high for a specific page or site, it might mean that the content on that page is not what your visitor wants or expects. When you provide a link in a document, social media post or email, make sure the content you are linking to makes sense to the visitor. For example, if your email marketing talks about registering for a specific event, a link directly to the event page or registration form will make the most sense to your recipient and will potentially decrease your bounce rate.

Higher education custom reports

Custom reports are a valuable tool in Google Analytics as they enable you to organize data in a way that makes sense to you and your specific goals. Stamats, a higher education marketing company, provided a series of custom reports valuable for analyzing higher education websites:

  • Visitors by Region and City. This report helps you determine if your target market (such as a geographically defined recruitment area) matches the geographic location of your actual visitors.
  • Quality of Visitors by Source and Interaction. This report helps you understand how your users are finding and interacting with your site. Are your visitors coming more from Google searches, direct links or social media? Based on the data in this report, you can better target the sites your visitors are using to find your site.
  • Mobile Data. This report shows you how many visitors access your site from mobile devices and what device they are using.
  • Page Performance. This report helps you evaluate what pages are successful at bringing visitors to your site (entrances), which pages visitors spend the most time on and which pages helped visitors convert a specified goal. For example, if you want a visitor to complete a specific action, a link to that action should be placed on pages that serve as strong entrances to your site.

Adding custom reports to your accounts

The custom reports outlined above can be added to your Google Analytics account by following the steps below:

  1. Log in to Google Analytics in another browser tab
  2. Switch to the Old Version of Google Analytics using the top right links, if necessary
  3. Click on the name of the report you wish to save from the list above. The report will now appear in Google Analytics.
  4. Scroll to the bottom of the page and select the appropriate profile(s) for the report
  5. Click save

The report should now appear in your custom reports tab for the profile you selected. If you are like to use the new version of Google Analytics, you can transfer your reports from the old version. Simply switch the view back to the new version, click the Custom Reports tab in the appropriate profile and click the Migrate button. Your custom reports will now appear in the new version of Google Analytics.

Filed Under: Training, web strategy and development Tagged With: bounce rate, custom reports, google analytics, website

« Previous Page

Categories

  • Accessibility
  • brand
  • email marketing
  • Mobile
  • News
  • Omni CMS
  • Redesign
    • Academic websites
    • Web redesign 2015
  • Social media
    • Social media kit
  • template
    • updates
  • Training
  • Video
  • Web Press
  • web strategy and development
    • Technical
  • Web Support
  • WordPress blogs

Meta

  • Log in
  • Entries feed
  • Comments feed
  • WordPress.org

Connect with web strategy and development

  • Twitter

Make your Missouri statementMake your Missouri statement
  • Last Modified: July 20, 2011
  • Accessibility
  • Disclaimer
  • Disclosures
  • EO/AA/M/F/Veterans/Disability/Sexual Orientation/Gender Identity
  • © Board of Governors, Missouri State University
  • Contact Information
  • Healthcare MRFs
 

Loading Comments...