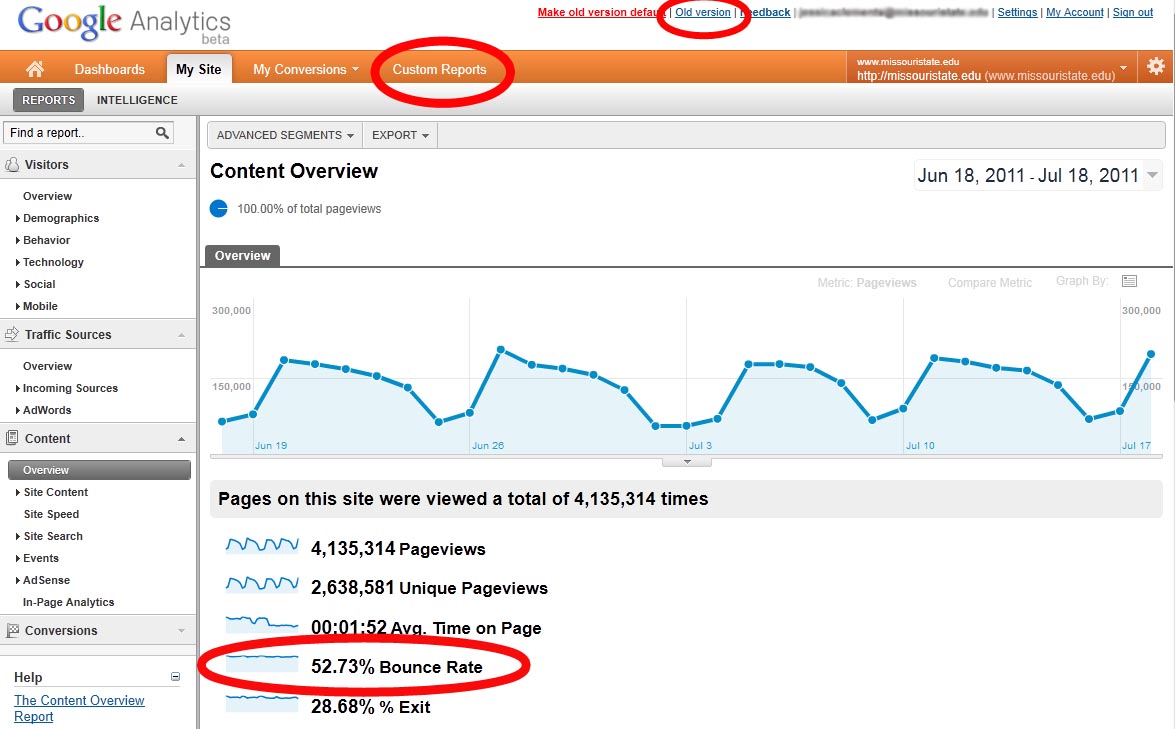
 Three weeks ago I was able to attend a webinar on Google Analytics for higher education websites hosted by Stamats. This webinar focused on explaining a series of custom reports developed by the company. I wanted to share these reports along with an explanation of a common Google Analytics statistic—bounce rate.
Bounce rate
When you open about any report in Google Analytics, bounce rate is a common statistic provided. But what does bounce rate mean?
Bounce rate refers to the percentage of single-page visits which occur when a visitor immediately leaves a landing page.
A low bounce rate is 40-45 percent. A decent bounce rate is 45-60 percent. If the bounce rate for a particular site is higher than 60 percent, you may want to examine how visitors are getting to that page and evaluate if your content is valuable to those visitors.
What does it tell you?
If the bounce rate is high for a specific page or site, it might mean that the content on that page is not what your visitor wants or expects. When you provide a link in a document, social media post or email, make sure the content you are linking to makes sense to the visitor. For example, if your email marketing talks about registering for a specific event, a link directly to the event page or registration form will make the most sense to your recipient and will potentially decrease your bounce rate.
Higher education custom reports
Custom reports are a valuable tool in Google Analytics as they enable you to organize data in a way that makes sense to you and your specific goals. Stamats, a higher education marketing company, provided a series of custom reports valuable for analyzing higher education websites:
- Visitors by Region and City. This report helps you determine if your target market (such as a geographically defined recruitment area) matches the geographic location of your actual visitors.
- Quality of Visitors by Source and Interaction. This report helps you understand how your users are finding and interacting with your site. Are your visitors coming more from Google searches, direct links or social media? Based on the data in this report, you can better target the sites your visitors are using to find your site.
- Mobile Data. This report shows you how many visitors access your site from mobile devices and what device they are using.
- Page Performance. This report helps you evaluate what pages are successful at bringing visitors to your site (entrances), which pages visitors spend the most time on and which pages helped visitors convert a specified goal. For example, if you want a visitor to complete a specific action, a link to that action should be placed on pages that serve as strong entrances to your site.
Adding custom reports to your accounts
The custom reports outlined above can be added to your Google Analytics account by following the steps below:
- Log in to Google Analytics in another browser tab
- Switch to the Old Version of Google Analytics using the top right links, if necessary
- Click on the name of the report you wish to save from the list above. The report will now appear in Google Analytics.
- Scroll to the bottom of the page and select the appropriate profile(s) for the report
- Click save
The report should now appear in your custom reports tab for the profile you selected. If you are like to use the new version of Google Analytics, you can transfer your reports from the old version. Simply switch the view back to the new version, click the Custom Reports tab in the appropriate profile and click the Migrate button. Your custom reports will now appear in the new version of Google Analytics.

