Missouri State University

Skip to content Skip to navigation
a b c d e f g h i j k l m n o p q r s t u v w x y z

Web Strategy and Development Blog

  • Web Strategy and Development
  • Web Support
  • @msuweb

Latest Campus Map Source Code

May 1, 2013 by Web Strategy and Development

Campus map

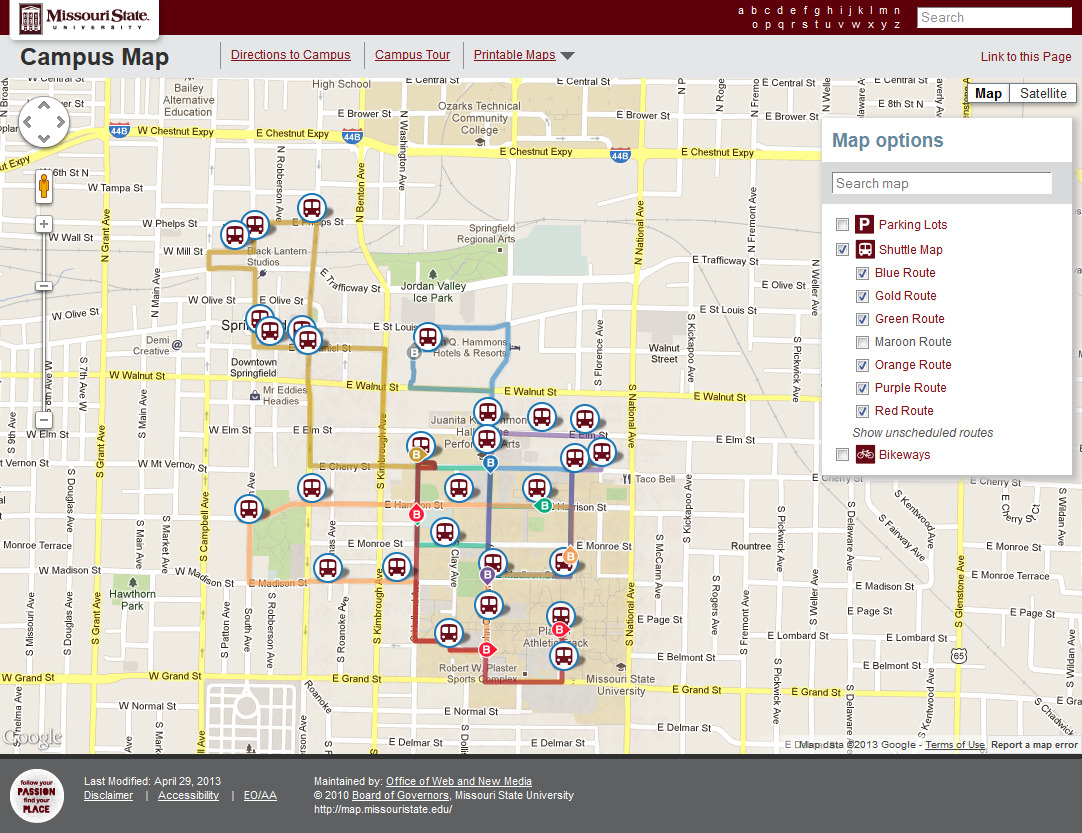
The latest refresh of the Missouri State Campus Map continues to utilize the Google Maps API v3. The JavaScript for the Campus map has been rewritten from scratch. Now all three versions of the map use a common source code:

  • Desktop view
  • Mobile view
  • Embeded view

The source code was also rewritten to make better use of events. The shuttle layer code in particular was completely redesigned.

The map code is annotated with JSDoc tags for Closure-compiler and supports ADVANCED_OPTIMIZATION compilation with the experimental type-based optimizations.

  • Uses the Missouri State common js library
  • Common map code: map_v2_uncompressed.js
  • Soy utilities: soyutils.js
  • Soy templates: map_v2_templates.soy.js

Map controls – specific to each view

  • Desktop controls
  • Mobile controls
  • Embeded controls


Filed Under: Mobile, Redesign, Technical Tagged With: javascript, map

The Return of Shuttle Tracking

April 30, 2013 by Web Strategy and Development

Shuttle bus and app

Shuttle bus and appSeveral years ago, we helped pilot a program to provide near real-time tracking of shuttles in the campus shuttle system. That original system relied on BlackBerry phones in the shuttles to transmit GPS data. While the system was hugely popular, the phones did not handle the wear and tear of everyday use and had a lifespan of about six months. After the second set of devices began failing, we realized that the original system was not maintainable and so discontinued the service while we searched for a new solution.

New GPS hardware

The first step in the system was to find a different way to send GPS data from the shuttles. We quickly realized that our system requirements were anything but the industry norm:

  • Send updated coordinates at least every 10 seconds. Most industry devices only update every minute or more.
  • Be permanently installed under the dash.
  • Have a reasonable maintenance cost. Devices using cellular networks incurred monthly service charges nearing $30 per month for every shuttle.

After many hours of searching, Corbin Campbell in Electronic Support Services found a device which uses a private radio network to transmit updates every two seconds. While there was a moderate up-front cost in infrastructure, ongoing maintenance costs are extremely low. After a quick test to make sure that we could actually get reception over all of the shuttle routes, the system was purchased and installed in all of the Bearline shuttles.

Campus map feature upgrade

Along with the shuttles, the campus map was refreshed to add even more support. New features include:

  • High resolution graphics for mobile devices with high-density displays.
  • Shuttle tracking re-enabled.
  • Improved GPS functionality for any supporting devices (previously restricted to phone view only).
  • Refinements to location search.
  • SSL support and a new address.

Check out the improved campus map!

Filed Under: Mobile, Technical Tagged With: map

Testing new shuttle tracking hardware

November 7, 2012 by Web Strategy and Development

Testing shuttle tracking hardware in Sunvilla

Testing shuttle tracking hardware in Sunvilla
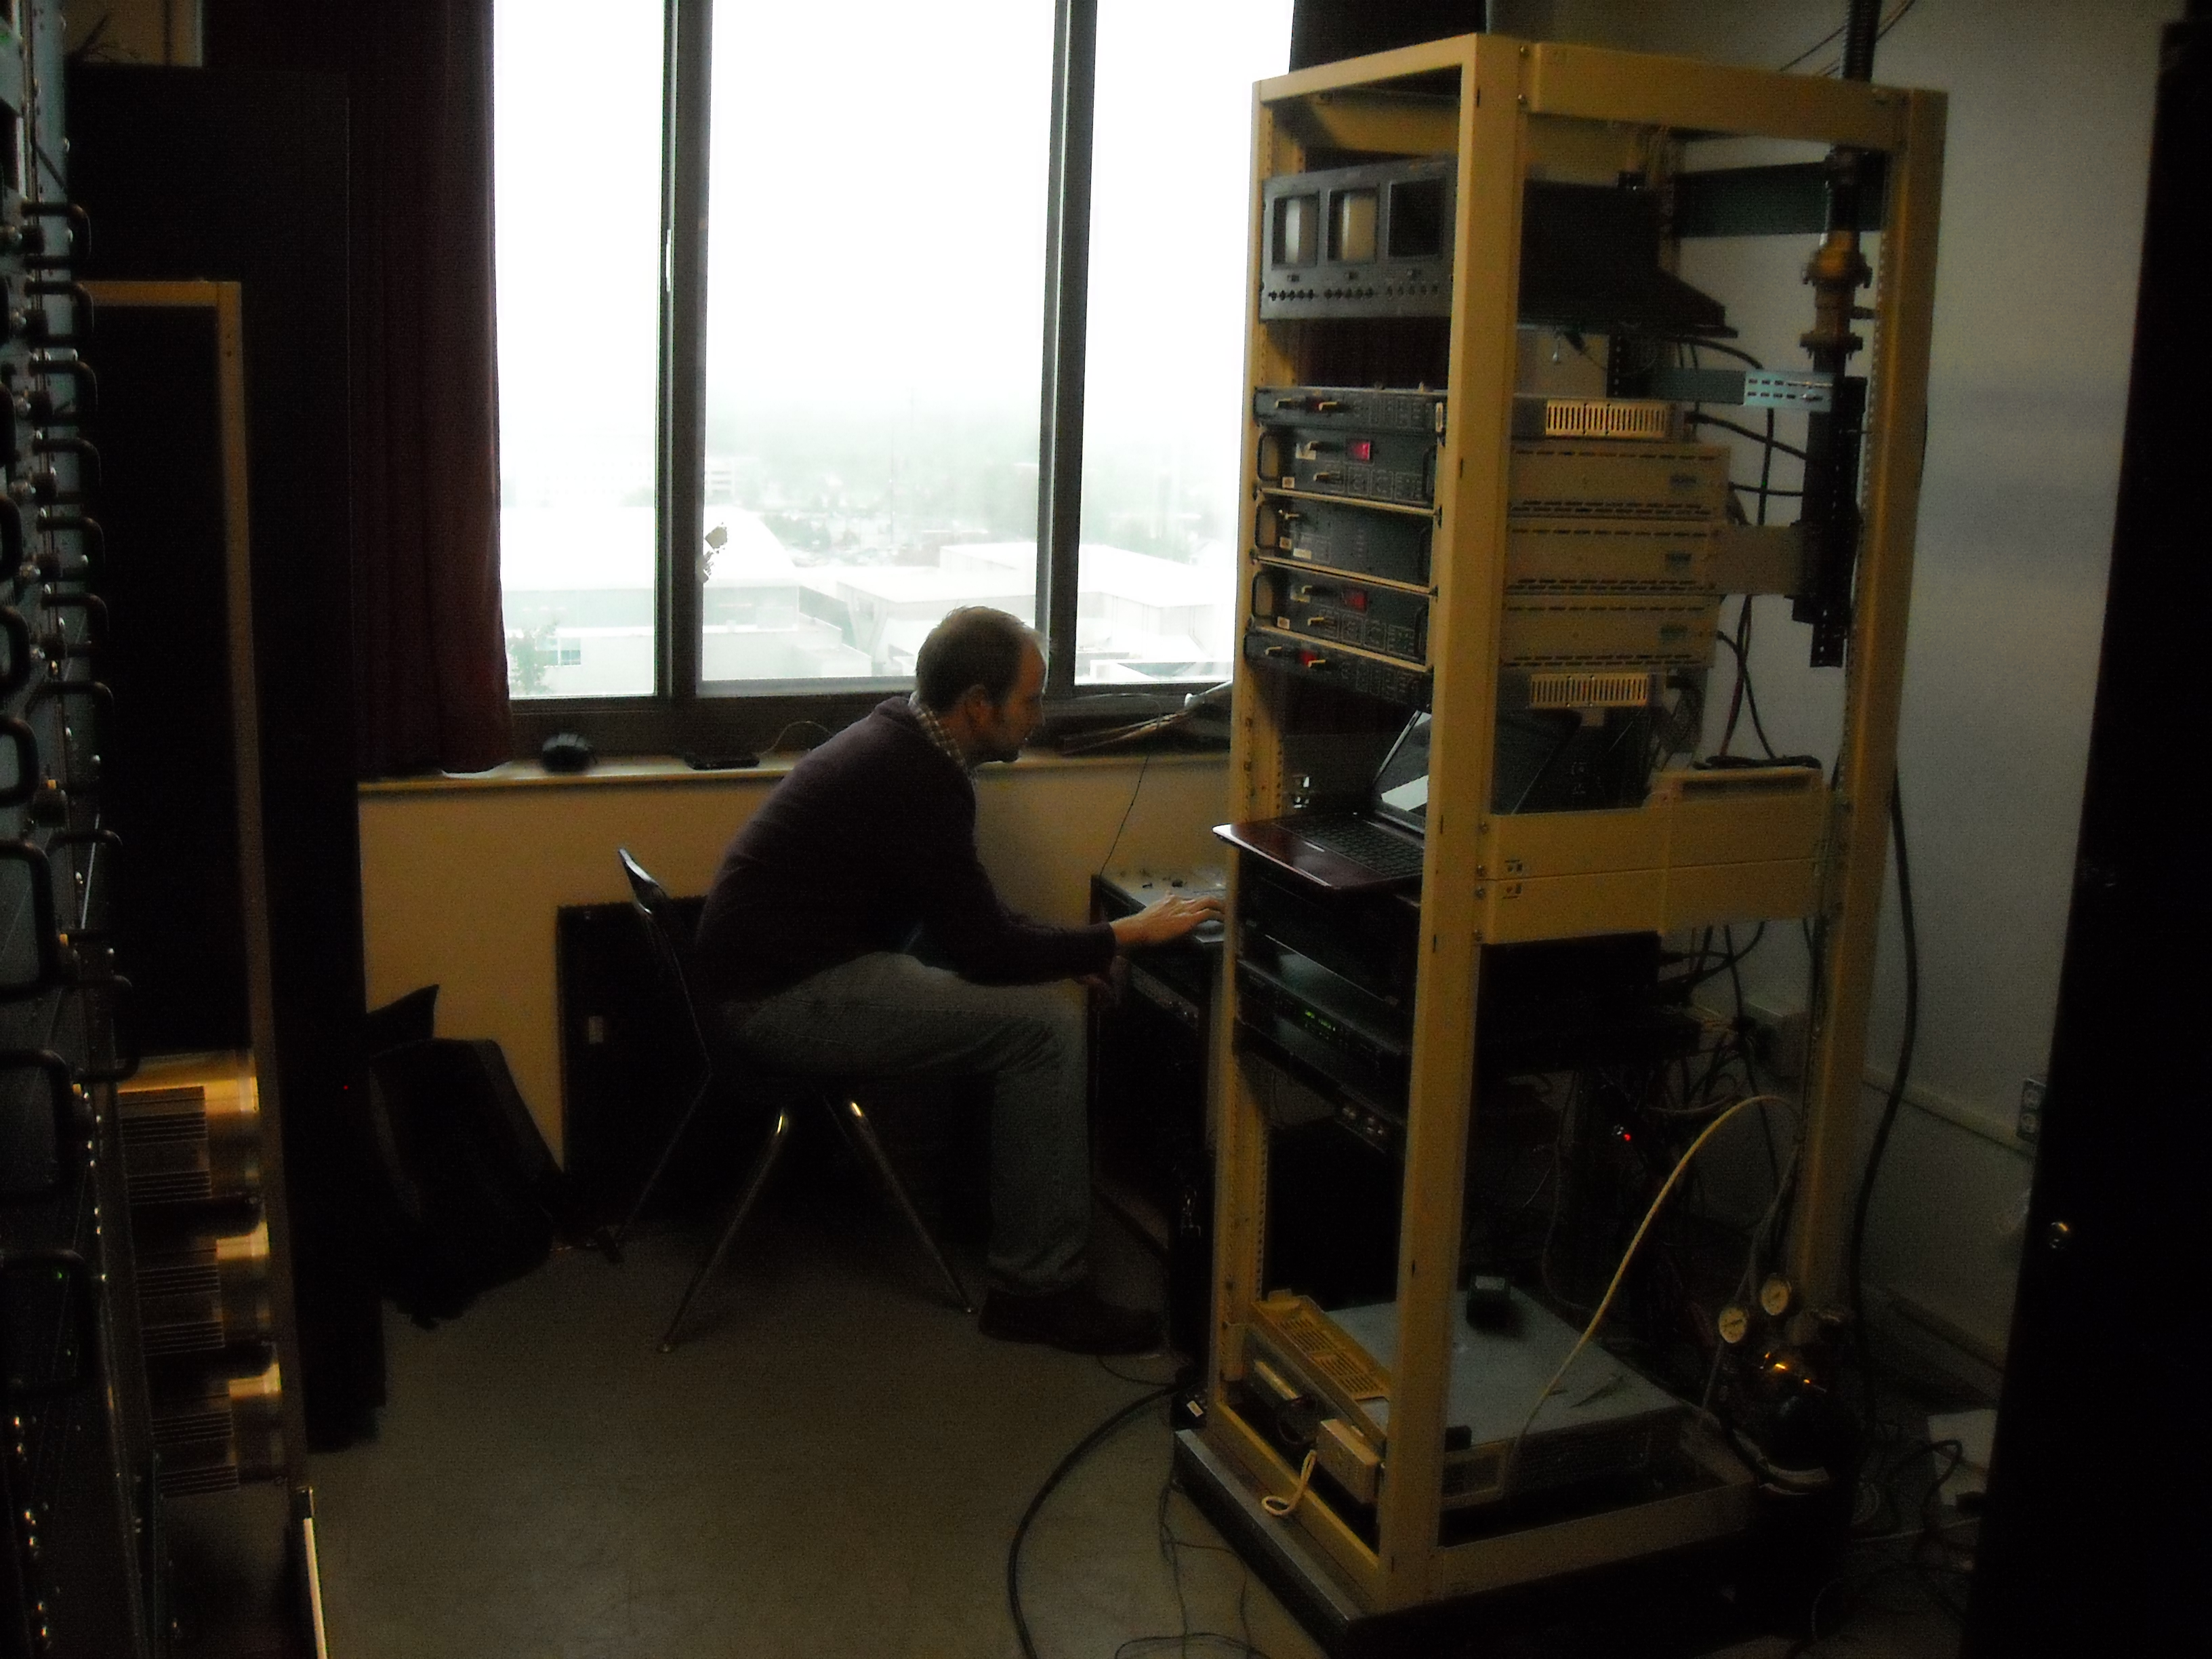
Two years ago we assisted in a pilot program to track the real-time location of the campus shuttles. That effort was a student project and used Blackberry phones in the shuttles for GPS devices. The major downfalls of that solution was the wear and tear on the equipment (phones lasted around 6 months) and the monthly cellular data charges. Even though the phones were using very little data, the cellular charges were being increased to around $30/month for each shuttle.

After a year the system went offline while a more permanent solution was investigated which relied on the campus radio network rather than on cellular data. We recently had the opportunity to test new equipment which we hope will assist in relaunching the service next semester.

Filed Under: Mobile, Technical Tagged With: map

Speed Up Your Map with Closure-Compiler

March 26, 2011 by Web Strategy and Development

Google recently posted a presentation I gave on using Closure Compiler to optimize your maps.

[youTubeVideo url=”https://www.youtube.com/watch?v=-dFqoXXe5VM”]

Slides: Speed up your map with Closure Compiler

Filed Under: Technical Tagged With: javascript, map

Creating points and shaded areas on the map

December 2, 2010 by Amanda Isaacs

University units can use the campus map to mark out event sites, specific locations, or to visualize information that pertains to a certain place.  And doing this isn’t as hard as it sounds.

To make your points appear on the map, you’ll have to create a KML file that contains all the information about those points. I’ll show you how to do that.

First, you’ll need to open up Google Earth.  Google Earth is a pretty nice program that may remind you of Google Maps, but it has more powerful features and is somewhat different to navigate. The biggest difference is that everything is in 3D – before the introduction of the Earth feature in Google Maps, this was the only way users could experience this sort of real-world texturing with 3D models and terrain. You’ll have to navigate to wherever you want to place your points; presumably this will be in Springfield or near Missouri State’s campus.

Making Points

Once you’re looking at the area you want to add your point to, you’ll need to press the Add Placemark button. Located just above the viewer window, it looks like a yellow thumbtack. This will put a placemark in the center of your viewer, which you can drag to exactly the correct location. You can also edit the name of what you’re marking and write a short description in the New Placemark window that appears. Once you click the OK button, the placemark will be added to your “Places” in the sidebar. If you’re going to create more than once placemark, it’s a good idea to make a single folder that you can put all of them in. You can do that by pressing Ctrl+Shift+N or clicking “Add Folder” under the Add menu.

Once you’ve created all your placemarks, highlight the folder that contains ONLY them and copy it by pressing Ctrl+C. This will put the code that describes the placemarks in your clipboard. If you open up a text editor like Notepad on Windows, you can paste it there. At first it will contain a lot of excess information, but you’ll need to edit it and remove everything inside the <Style> and <LookAt> tags. After some trimming, your file should look something like this by the time you’re done with it:

<?xml version="1.0" encoding="UTF-8"?>
<kml xmlns="http://www.opengis.net/kml/2.2"
    xmlns:gx="http://www.google.com/kml/ext/2.2"
    xmlns:kml="http://www.opengis.net/kml/2.2"
    xmlns:atom="http://www.w3.org/2005/Atom">
  <Document>
    <name>Missouri State University Designated Smoking Areas</name>
    <Placemark>
      <name>Power House Smoking Area</name>
      <description><![CDATA[Designated smoking area. For more information, see
        Missouri State's <a href="http://www.missouristate.edu/policy/tobaccouse.htm">
        Tobacco Use/Smoking Policy</a>.]]></description>
      <Point>
        <coordinates>-93.27892451338917,37.19760625199317,0</coordinates>
      </Point>
    </Placemark>
  </Document>
</kml>

<?xml version="1.0" encoding="UTF-8"?> <kml xmlns="http://www.opengis.net/kml/2.2" xmlns:gx="http://www.google.com/kml/ext/2.2" xmlns:kml="http://www.opengis.net/kml/2.2" xmlns:atom="http://www.w3.org/2005/Atom"> <Document> <name>Missouri State University Designated Smoking Areas</name> <Placemark> <name>Power House Smoking Area</name> <description><![CDATA[Designated smoking area. For more information, see Missouri State's <a href="http://www.missouristate.edu/policy/tobaccouse.htm"> Tobacco Use/Smoking Policy</a>.]]></description> <Point> <coordinates>-93.27892451338917,37.19760625199317,0</coordinates> </Point> </Placemark> </Document> </kml>

That’s just for one point. If you have multiple points, they’ll appear as additional items inside a <Placemark> tag. Remember, if you copy a single placemark from Google Earth, you’ll only get that placemark pasted to your code. Putting everything in the same folder makes sure you have it all copied over.

Once you’ve cleaned up the file, you can save it; be sure to type in the .kml extension after your filename so that it works correctly. So long as you upload that file to a working URL it will work with the map.

Shaded Areas

If you want to show a shaded area in your KML file, there’s  just a little more legwork involved. When in Google Earth, next to the “yellow thumbtack” Add Placemark button, there’s an “Add Polygon” tool (with a little hexagon in it). Clicking it will let you start drawing a shape on the map, and open a window letting you edit the information of that shape. Just type in a name and a description; we won’t use the rest of those features. Don’t click OK yet – once you do that, Google Earth will think you’re finished making your polygon.

Click on the map where you’d like the first point or edge to the shape you’re drawing. After clicking at least 2 additional points at other angles, you’ll see a white area appear where your polygon currently covers. Keep clicking the points at the corners of the area you’re creating; if you accidentally click somewhere you didn’t intend to, you can press delete to eliminate preceding points.  If you click and drag, you’ll create a curved line by laying down multiple points very close together. Most of the time you shouldn’t need to do this.

After you’ve laid down your last point, you can always fine tune your polygon by clicking and dragging the points you’ve already made to where you want them to be. This will also let you see where exactly the line between points falls. When you’re done, click OK on the New Polygon window. You can also go back and edit where your points are later by right-clicking the polygon (which shows up in the “Places” partition of the sidebar) and clicking Properties. This will take you back to the drawing and editing process.

After the polygon has been created, copy it with Ctrl-C, just like you would a placemark, and paste it into Notepad or Textpad. If you copy just that polygon,  you’ll wind up with the extra KML you wouldn’t get if you copied a folder with the rest of the points or even other polygons you may want to include. This time, you’ll need to include a little extra code. Beneath the <name>*Your document’s name*</name> tags, put this:

<Style id="my_styles">
  <LineStyle>
    <color>ffadaaa2</color>
  </LineStyle>
  <PolyStyle>
    <color>bce0bc54</color>
  </PolyStyle>
</Style>

<Style id="my_styles"> <LineStyle> <color>ffadaaa2</color> </LineStyle> <PolyStyle> <color>bce0bc54</color> </PolyStyle> </Style>

And then put this inside your polygon’s <Placemark> tags, beneath the name of the area.

<styleUrl>#my_styles</styleUrl>

<styleUrl>#my_styles</styleUrl>

Just put your own name for the style instead of “#my_styles”. You’ll need to pick a color to use though – KML code for colors is a bit strange, so I used KML Color Converter to get it right. This will let you pick a color already on your screen and set a transparency level you feel is good. Just replace the color code inside the <PolyStyle> tags to get it to look how you’d like.

Once all that is done, you can save your file and upload it somewhere live that works for you.

Using your KML with the map


Go to the map. Click the map button, then in the text box where it says “Search map,” enter the url of your KML. The KML I made for IDEA Commons is here : http://www.missouristate.edu/assets/ideacommons/IDEAoutlinenbuild.kml. So copy that address, and paste it in the text box. You’ll see what my overlay and points looks like. Using the URL for your kml will display what you’ve created. Once you’re looking at it on the map, click the “Link to this Page” link above the map buttons, below the Missouri State Search box at the top right of the page. You’ll see a small window open with a direct link to that map, and some html code that will embed it in your web page. Either of these will be useful to lead users straight to this page, rather than having them copy/paste the long url for your file.

Filed Under: Technical Tagged With: map

Next Page »

Subscribe

Enter your email address to subscribe to this blog and receive notifications of new posts by email.

Follow @MSUWeb

My Tweets

Calendar

  • Complete Calendar

Categories

  • Accessibility
  • brand
  • email marketing
  • Mobile
  • News
  • Omni CMS
  • Redesign
    • Academic websites
    • Web redesign 2015
  • Social media
    • Social media kit
  • template
    • updates
  • Training
  • Video
  • Web Press
  • web strategy and development
    • Technical
  • Web Support
  • WordPress blogs

Meta

  • Log in
  • Entries feed
  • Comments feed
  • WordPress.org

Connect with web strategy and development

  • Twitter

Make your Missouri statementMake your Missouri statement
  • Last Modified: November 9, 2017
  • Accessibility
  • Disclaimer
  • Disclosures
  • EO/AA/M/F/Veterans/Disability/Sexual Orientation/Gender Identity
  • © 2013 Board of Governors, Missouri State University
  • Contact Information
 

Loading Comments...